S&P500 analysis using Python, MySQL and Tableau
See Python code in: https://github.com/felipeOL10/Credit-Card-Customer-MySQL/blob/main/analysis-of-the-stock-market%20(1).ipynb
See MySQL code: https://github.com/felipeOL10/SP500-analysis/blob/main/SP500%20analysis.sql
See Tableau vizualization: https://public.tableau.com/app/profile/felipe.lima6878/viz/SP500analysis/Painel1
This dataset comprises the SP500 companies in 2020, obtained in the kaggle datasets (https://www.kaggle.com/datasets/paytonfisher/sp-500-companies-with-financial-information).
The objective of this project is to analyse both companies and sectors in the SP500. Moreover, I´m going to perform a multiple regression analysis in order to undertand the impacts of fundamentals and ratios in the price of the stocks.
#Get name of columns in the dataset
list(data.columns)
['Name', 'Sector', 'Price', 'Price/Earnings', 'Dividend Yield', 'Earnings/Share', '52 Week Low', '52 Week High', 'Market Cap', 'EBITDA', 'Price/Sales', 'Price/Book', 'SEC Filings']
#Missing values
data[pd.isnull(data)].count()
Name 0 Sector 0 Price 0 Price/Earnings 0 Dividend Yield 0 Earnings/Share 0 52 Week Low 0 52 Week High 0 Market Cap 0 EBITDA 0 Price/Sales 0 Price/Book 0 SEC Filings 0 dtype: int64
#Industries in the dataset
data.Sector.unique()
array(['Industrials', 'Health Care', 'Information Technology', 'Consumer Discretionary', 'Utilities', 'Financials', 'Materials', 'Real Estate', 'Consumer Staples', 'Energy', 'Telecommunication Services'], dtype=object)
#Number of companies per industrie
data.Sector.value_counts()
Consumer Discretionary 84 Information Technology 70 Financials 68 Industrials 67 Health Care 61 Consumer Staples 34 Real Estate 33 Energy 32 Utilities 28 Materials 25 Telecommunication Services 3 Name: Sector, dtype: int64
Descriptive statistics
data.describe()
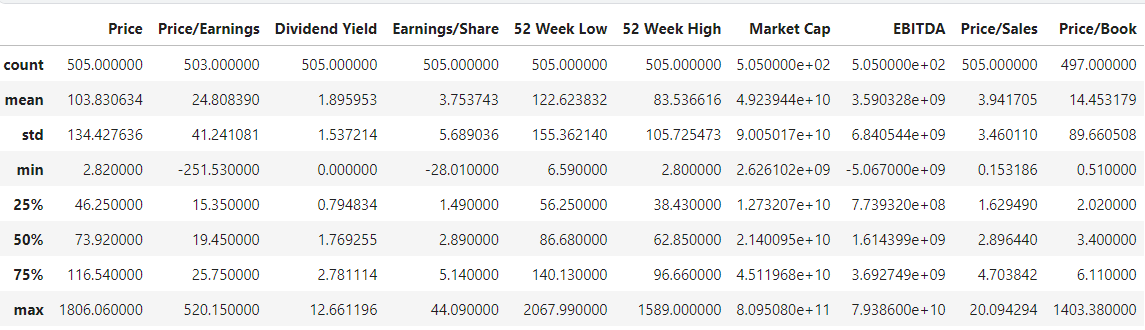
We can see that the mean P/E was 24.8;
The lowest market cap for a company in the sp500 was around 2 billion;
In average, the dividend yield of a sp500 company was around 1.9%.
In average, companies in the sp500 are profitable.
Max and min p/e `
column = data["Price/Earnings"]
max_value= column.idxmax()
print(max_value)
print(column.max())
CRM 520.15
min_value= column.idxmin()
min_value
print(min_value)
print(column.min())
APA -251.53
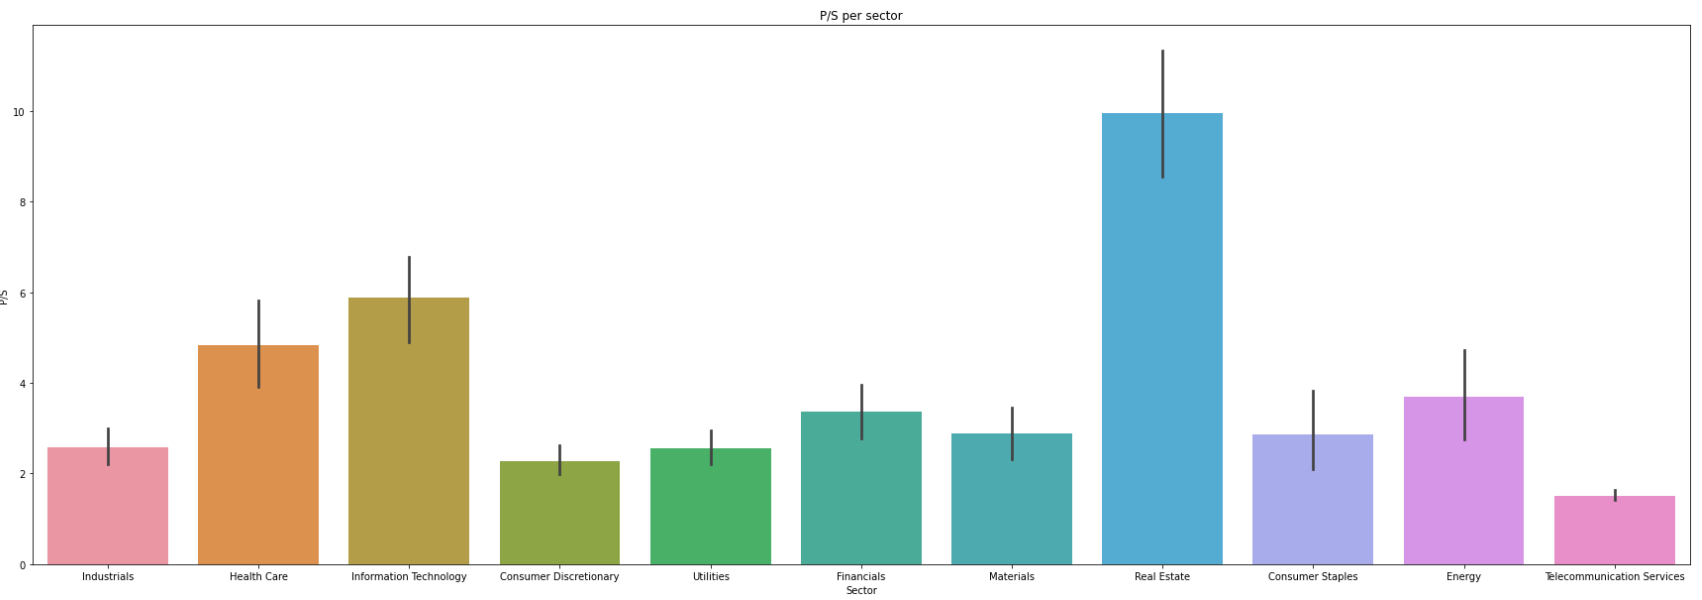
P/E, P/S, Dividend yield and EBITDA per sector

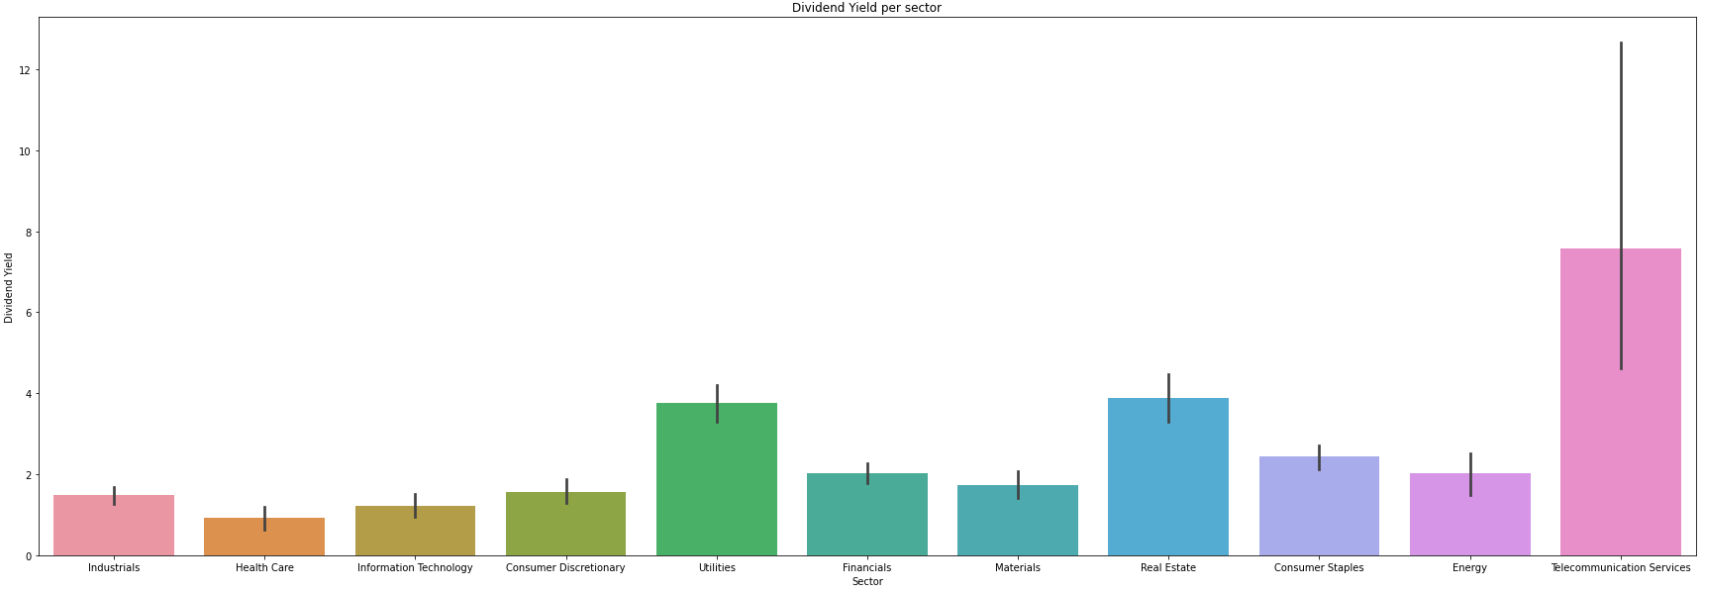
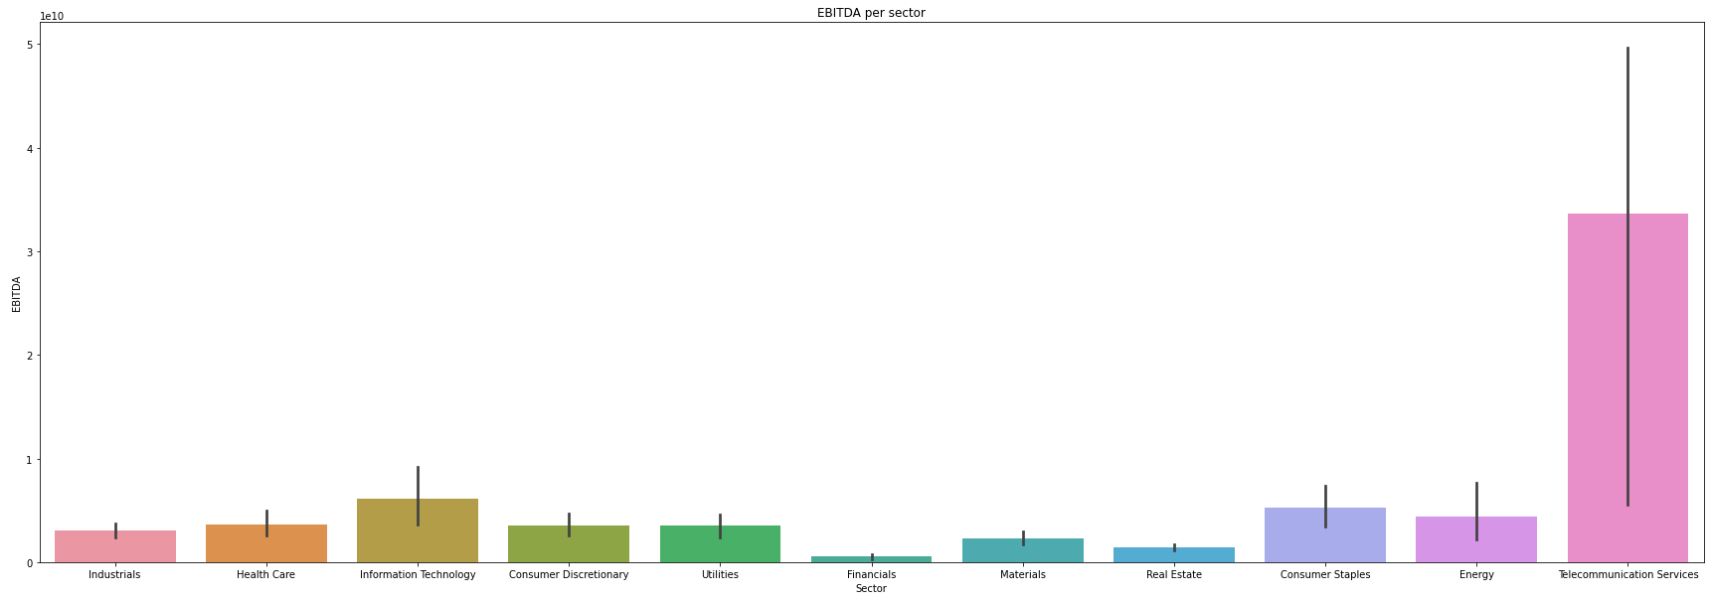
The most profitable sector is the telecommunication services, providing also the highest dividend yield;
According to the P/E ratio, the energy sector is the most expensive and the telecommunication services is the least expensive;
According to the P/S, the real estate sector is the most expensive and health care the least.
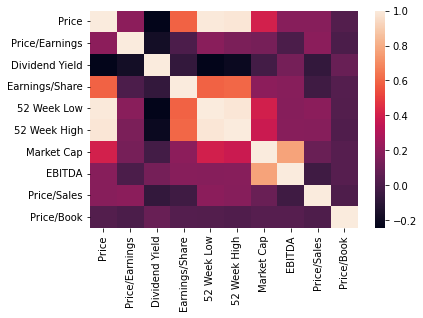
Pearson correlation
EBITDA is higly correlated to the market cap of the companies.
P/S, P/E and P/B are almost non correlated to EBITDA;
Price is positivelly correlated with all multiples, especially with the P/E;
EPS is positivelly correlated with the price.
EPS is positivelly correlated with EBITDA.
![]()
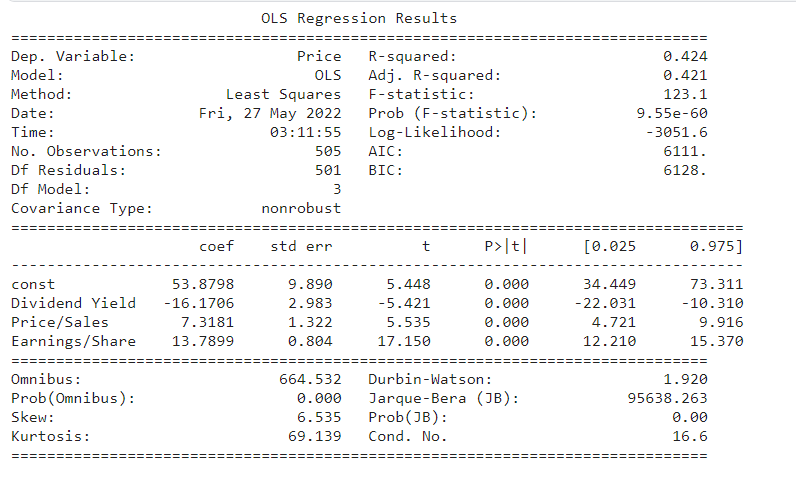
Multiple linear regression
The independent variables in the model explain 42,4% of the price.
All variables in the model are significant at 1%.
EPS has a positive effect on price. In fact, an increase of one unit in the EPS will increase the price in 13.8, ceteris paribus.
The price to sales has also a positive effect. Moreover, an increase of one unit in the P/S will increase the price by 7,3.
The dividend yield has a negative effect on price. In fact, an increase of one unit in the EPS will decrease the price in 16.2, ceteris paribus.